


Menu engineering is fast becoming standard practice for sophisticated restaurateurs looking to squeeze the maximum amount of profit out of their menu without sacrificing on quality.
This article is a comprehensive, follow along guide to menu engineering for restaurants.
What is menu engineering?
The simple objective of menu engineering is to increase profit per guest at a restaurant. This is achieved through a careful analysis of the profitability and popularity of individual menu items, followed by the placement of items on the menu to encourage guests to choose particular dishes.
Menu engineering is therefore the combination of analysis of your ingredients cost and sales numbers, combined with graphic design and psychological techniques that encourage certain behavior from restaurant guests.
For restaurants there are undeniable advantages to menu engineering over other methods for boosting profits.
These include a proven track record of the effectiveness of menu engineering, making decisions based on data rather than intuition and results that can be easily tracked and modified. It also gives restaurants a way of refreshing their menu without the fear of losing profit.

Menu engineering for newly opening restaurants
On the surface, opening a restaurant is one of the most appealing options for anyone looking to start a business.
As a guest, you only see what the restaurant wants you to see: food, drinks, ambience. How many times have you eaten in a restaurant only to say to yourself, “I can do this!”.
The problem is, you don’t get to see what it really takes to not only provide an enjoyable experience, but also make a profit doing so: purchasing, hiring/training, management, overhead expenses. If not properly planned for, these obstacles could doom a restaurant before its doors are even open.
To quote Aristotle, “Well begun is half done”, or in other words, proper planning is half the job. That couldn’t be truer when opening a restaurant. The heart and soul of the restaurant should be established before any further steps are taken so everything fits the look, feel, and vibe that is meant to be evoked.
One of the simplest ways to instill this, but often one of the most overlooked, is the menu. A properly engineered menu should give the guests a true understanding of “who” the restaurant is, and it will also ensure profitability by establishing food costs, operating costs, and customer satisfaction.

Customer research and menu engineering
Menus are a reflection on the establishment and should be considered as such. The guest should have an easy time connecting to the restaurant through its use of ingredients, price points, menu descriptions and personalized service. The ingredient choices say a lot about the establishment.
We have reached a point where customers have become more conscious of what they consume. According to David Henkes, Technomic’s senior principal, 69% of consumers worldwide cited the availability of healthy options being a very important factor in choosing where to buy a meal.
Along with the healthy food trend, are concepts of locally sourced and organic, which bring higher price points and lower shelf life. Buying healthy, locally sourced, organic ingredients will most definitely cause your food cost to be higher, in turn making the menu price higher. This why knowing your target market is so crucial to menu engineering.
Research about the area/neighborhood the restaurant is located in will give you a better idea of the average household income, spending patterns, and competition, and if locally sourced/organic is something to consider.
These will be key decisions as you go through the menu engineering process. The average household income of the surrounding area is usually representative of how much they are willing to spend. When selecting a restaurant, 44% of consumers name the overall price as a top priority.
Spending patterns and local competition will help determine if you’re offering something of value to the community. If you want to open a pizza place near 10 pizza parlors or Italian restaurants, you may want to reconsider opening in that area. The amount of competition is way too high, affecting the number of customers, and your price point to stay competitive.
Now, if you are offering unique toppings, then you can be priced higher as a specialty product. Your distinguishing features must be presented to the customers, either in your use of ingredients, or in the overall design and ambience.
The menu engineering formula
Ultimately menu engineering is a numbers game and therefore requires some data analysis. This is usually done in Microsoft Excel or some other spreadsheet software.
We will use the following menu engineering graphs, (available to download for free from this post above):
- Menu Item Costing
- Recipe Information and Profit Sheet
- Weekly Food Cost Tracking
- Contribution Margin Analysis
- Profitability vs Popularity Matrix Analysis
Calculating the food cost of menu items
An understanding of the popularity and profitability of the menu items is essential when executing a menu engineering plan.
To ensure profitability, factors such as food cost, operating costs, and contribution margin must be confirmed, then verified regularly.
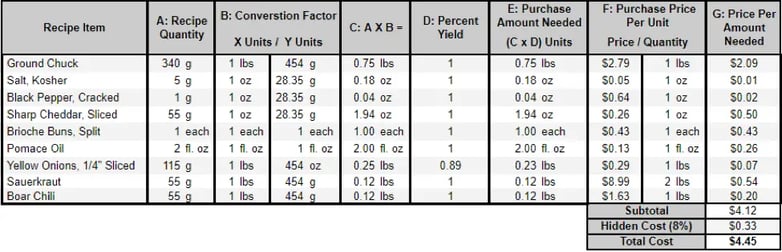
Food cost is the total amount of money spent on the ingredients of a dish. In this case, we will be costing out the Chili Cheeseburger recipe.
This spreadsheet is included in the complete guide to menu engineering. Download at the end of this article.
The dish is broken down into every ingredient that goes into the recipe, which have been clearly defined, and quantified.
In addition to the quantity of the individual ingredients, there are two values that are necessary to calculate the cost of a dish: percent yield and purchase price per unit.
The percent yield is the quantity that is considered edible (edible portion or “EP”), divided by the amount that was originally purchased (as purchased or “AP”). In the costing, “Ground Chuck” has a percent yield of 1, which means that 100% of the purchased amount is edible.
On the other hand, “Yellow Onions, ¼” Sliced” has a percent yield of 0.89, stating that 89% of the onion is edible. Since the percent yield is dependent on the AP, it will have a direct correlation to the purchase unit.
The chuck was purchased pre-ground, allowing 100% of it to be used, but if it had been purchased whole, the percent yield would be 0.85, instead of 1, and the opposite would be true if the onions were purchased pre-sliced.
Calculating the profitability of menu items
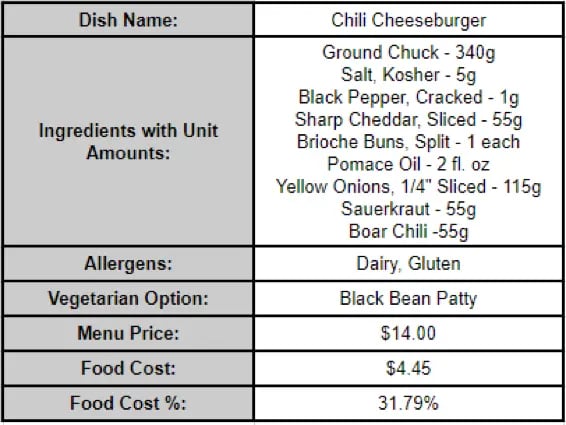
Once every item on the menu has been costed out, the next step in the menu engineering formula is to complete an information sheet with the ingredients and calculations, so you can determine a profitable selling price.
Profitable restaurants have food costs that range from 28%-35%. Each restaurant will differ in their operating costs, so this must be factored in when deciding the restaurant’s target food cost percentage.
The target percentage will be used to determine the target menu price.
Food Cost / Target Food Cost Percentage = Target Menu Price
 This spreadsheet is included in the complete guide to menu engineering. Download at the end of this article.
This document will help to catalogue all the information necessary for incorporating the dish into the menu.
When all the information sheets have been completed, you can discover if there are too many similarities between them (i.e., too many $14 items, every item contains dairy and gluten), or if the food cost percentage needs to be lower and make adjustments accordingly.
It also helps the staff to provide answers about substitutions.
The best way to keep track of these values is to do weekly calculations. This chart allows for changes to be made more frequently, saving the restaurant from going months with higher than anticipated labor or food costs.
![]()
This spreadsheet is included in the complete guide to menu engineering. Download at the end of this article.
Calculating menu item popularity vs profitability
Although the ingredient cost is an important value to keep track of in menu engineering, it should be used in tandem with the contribution margin when considering popularity and profitability.
The contribution margin can be calculated once the menu price and food cost have been established since it is the difference between the two. This number is a simple way to visualize the gross profit of an individual item. Using the menu price, food cost, and contribution margin, we can then incorporate sales figures to get an overall look at the menu.
Incorporating actual sales figures into your menu engineering worksheet
This spreadsheet is included in the complete guide to menu engineering. Download at the end of this article.
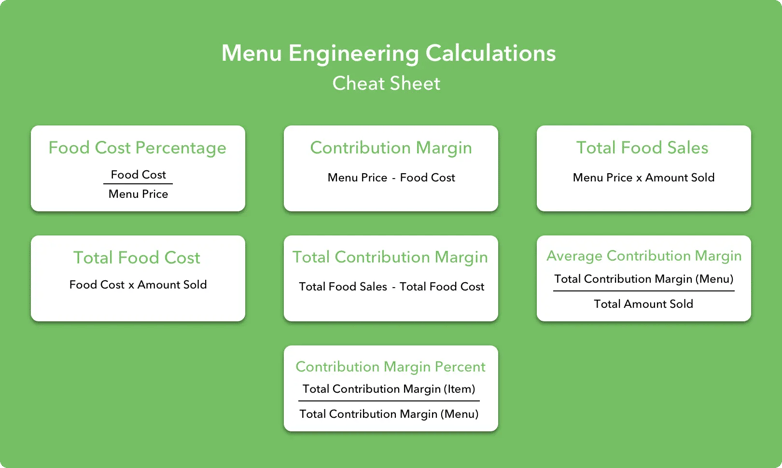
The free menu engineering cheat sheet below summarizes all the equations you need to know to properly implement the menu engineering process at your restaurant.
Finding your most popular and profitable dishes
When it comes to popularity, there will always be items that either sell extremely well, or don’t sell at all, and uncovering these items is key to maximizing the menu effectiveness.
Determining popularity isn’t as simple as looking at the number of dishes sold.
Each menu category (i.e., appetizers, salads, desserts) should be classified and calculated separately. You wouldn’t check the popularity of a side of fries against a grilled chicken sandwich since they serve different purposes within the meal itself.
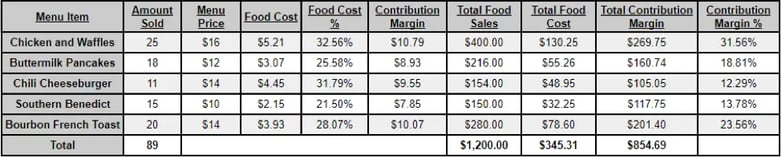
For example, the focus of the chart above is entrees. Since there are five dishes in the entree category, the expected popularity percentage would be 20% (100% / 5).
Taking that into consideration, the Chicken and Waffles, Buttermilk Pancakes, and Bourbon French Toast all have a higher than average level of popularity. After determining the average contribution margin ($854.69 / 89 = $9.60), we also see that the Chicken and Waffles ($269.75 / 25 = $10.79) and Bourbon French Toast ($201.40 / 20 = $10.07) are above average.
These items are the two most popular dishes, comprising almost 50% of the total number of dishes sold, and they bring in the highest gross profits.
Finding the least popular and unprofitable dishes
Examining the Chili Cheeseburger, we see that it is not only the least popular item, but it also has a high food cost percentage and an average contribution margin.
One way to increase the number of sales is to lower the price, but that would raise the already high food cost percentage, and it would have a negative effect on its contribution margin.
This is a dish that may need to be replaced on the menu, or have the ingredients altered to lower the cost, and hopefully increase sales.
If we compare the Chicken and Waffles to the Chili Cheeseburger, we notice that the costs are very similar, but the Chicken and Waffles has almost a 15% higher contribution margin.
With that in mind, you would want more of the Chicken and Waffles to sell because it will bring in more gross profit.
It is important to factor both food cost percentage and contribution margin because a dish with a high cost could have a high contribution margin, whereas a dish with a low cost could also have a high contribution margin.
To match the total contribution margin of the Chicken and Waffles, you would have to sell almost 20 more servings of Southern Benedict, so even though it has the lowest food cost percentage, it brings the least amount of gross profit into the restaurant.
Using a menu engineering matrix to find the best and worst menu items
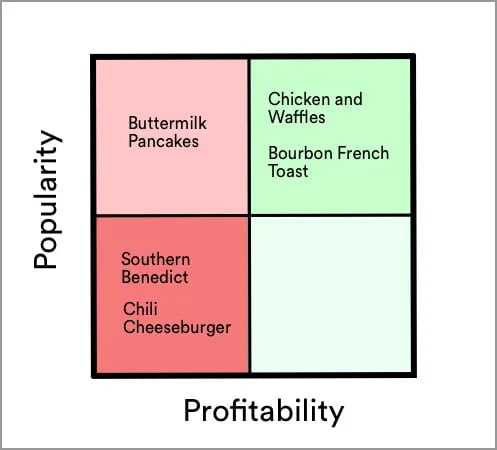
The easiest way to understand how the different dishes compare is to plot them in a segment grid, comparing profitability against popularity.
There are four main quadrants: low profitability and low popularity (Low-Low), low profitability and high popularity (Low-High), high profitability and low popularity (High-Low), high profitability and high popularity (High-High).
The required actions will differ depending on where the dish has been plotted.
Obviously, the dishes in High-High are perfect the way they are. The High-Low quadrant has dishes that either need to be presented more prominently on the menu and upsold more by the staff, or have the price lowered to entice more customers to purchase it. Lowering the price will inherently lower the profitability, so that should be a last resort.
The Low-High dishes may be staples that your customers have come to expect, but you could consider revamping them to increase profitability while maintaining their popularity. As with the High-Low, adjusting the price is also an option but it could have a negative effect on the popularity.
Finally, the Low-Low quadrant is an area that needs to completely be rethought. Since they already have a low popularity, you don’t have to be worried about customer’s noticing they’ve been removed or changed. They provide an opportunity to experiment a little more with new dishes or updated versions with higher profitability.
These calculations and comparisons should be done periodically to stay informed on any changes in your customer base, or in ingredient purchasing, to stay competitive in the restaurant industry.
How to design a well engineered menu?
The placement of the items on the menu will also influence the customer experience. Different categories (i.e., appetizers, entrees, desserts) should be clearly labeled and grouped together.
The goal is to minimize any confusion or barriers that may cause the customer to have a less than ideal experience.
There are menu best practices that will have more of a subconscious effect on the guest’s decision-making process. Placement of the menu price may seem like a simple choice, but it can cause customers to refrain from choosing a specific item.
When the price is separated from the dish, not only does it make it more difficult to distinguish which dish it is referring to, but it also makes the price more noticeable, possibly deterring some customers from choosing that item.
Generally, the first and last items on a menu, or within a category, are the most noticeable.
Other design features can cause specific items to be visually attractive as well, such as a box surrounding a higher priced item, and using larger font or different colors for those items. When deciding which items to “call out” to customers, you must determine their popularity and profitability, then use those variables to inform your decisions.
Why menu descriptions make a difference
Whilst crunching the numbers is the biggest task of menu engineering - isn't just about numbers. The look and feel of the menu determines how the restaurant will be perceived by the guests. As the single item that everyone will stare at for some time, it should emphasis the vibe of the restaurant.
Is it a classic French restaurant with beautifully written font and concise descriptions, or is it a slaphappy American restaurant with Arial font and long comical descriptions?
In either case, the general decor and design of the restaurant should match the menu so the customer has a cohesive experience.
As Anthony Bourdain said, “Context and memory play powerful roles in all the truly great meals in one's life.” A portion of that memory is how the dishes are described. The descriptions should note if the ingredients are locally sourced/organic, but the primary purpose is to attract or excite the guest into buying the item.
The use of expressive adjectives can make or break a description. According to researchers of a Cornell University study on descriptive food names, "Those who ate foods with evocative, descriptive menu names generated a larger number of positive comments about the food and rated it as more appealing, tasty and caloric than those eating regularly named counterparts.”
Here is an example of how much variety there can be when describing the same cheeseburger:
- ½ lb Patty, Cheddar Cheese, Sauteed Onions, Chili, Sauerkraut
- ½ lb Organic Beef Patty, Wisconsin Sharp Cheddar Cheese, Sauteed Spanish Onions, Wild Boar and Black Bean Chili, Homemade Sauerkraut
- ½ lb Jacks Farm Organic Beef Patty, Wisconsin 1-Year Aged Sharp White Cheddar Cheese, Sauteed Sweet Spanish Onions, Braised Wild Boar and Black Bean Chili, House-made Purple Sauerkraut
After reviewing the first description, you get the basic idea of what the item is: burger with cheddar cheese, onions, chili and sauerkraut.
As you begin to add more menu descriptors, that basic chili cheeseburger evolves into a specialty burger that demands a higher price.
The menu vocabulary is commonly disregarded, but a little goes a long way as an effective menu engineering technique.
Conclusion
The best menus implement the perfect combination of financial and design decisions that also match the brand of the restaurant.
There are many steps for engineering the perfect menu for your establishment, and time needs to be taken to explore these concepts, calculate these variables, and present your dishes in the best way possible.
The menu engineering process is never finished. Ingredient pricing will vary, and customer demographics and choices will continue to change, but it’s up to you to stay up-to-date on everything.
One of the most damaging mistakes is to spend the time and effort to properly engineer a menu, only to have it become completely ineffective over time. Constantly check your assumptions, and make sure that the menu doesn’t lose sight of the heart and soul of the restaurant.
Share this article!


.webp?width=144&height=72&name=Eat%20App%20Logo%20(3).webp "Eat App Logo")