


.svg)
.svg)


















.svg)

.svg)


-2-1.webp?width=200&name=image5%20(6)-2-1.webp)
%20(1)-1.webp?width=200&name=Eat%20(57)%20(1)-1.webp)
-1.png?width=1812&height=1072&name=TripAdvisor%20%26%20More%20Bookings%20(1)-1.png)
-2.png?width=1812&height=1072&name=Google%20Bookings%20(1)-2.png)
%20(1)-1.webp?width=200&name=Eat%20(62)%20(1)-1.webp)

-1.png?width=200&name=TripAdvisor%20%26%20More%20Bookings%20(1)-1.png)
-2.png?width=200&name=Google%20Bookings%20(1)-2.png)
-1.png?width=200&name=Instagram%20Bookings%20(1)-1.png)
-1-png.webp?width=200&name=Facebook%20Integration%20Rectangle%20(1)-1-png.webp)




.webp?width=200&name=download%20(1).webp)
%20(1)-2.webp?width=200&name=Eat%20(34)%20(1)-2.webp)
%20(1)-2.webp?width=200&name=Eat%20(18)%20(1)-2.webp)








Running a restaurant is two jobs in one. The first you fell in love with: great food, a full room, regulars who bring their friends. The second is quieter and far less romantic. It's the spreadsheet job, the one that runs on key restaurant metrics for sales, staffing, and cost.
Most restaurant owners are brilliant at the first job and wing the second. They cook by feel, so they run the restaurant business by feel too. That's exactly where money leaks out.
Experience is worth a fortune, but if the only number you watch is total sales, you're flying half-blind. The right restaurant metrics show what's working and what's quietly bleeding you dry, which is what lets you make informed decisions instead of guesses.
This guide walks through the essential restaurant metrics worth tracking, grouped the way restaurant owners actually think about them: money in, money out, and the guests who decide both. Each restaurant metric comes with a plain formula and a benchmark, so you know whether your number is protecting your profit margins or quietly wrecking them. Run the numbers well and the restaurant business gets a lot less stressful.

What restaurant metrics are, and why gut feel isn't enough
A restaurant metric is any number that measures how part of your business is doing: food costs, labor costs, table turnover, no-shows, review scores.
Key performance indicators, or restaurant KPIs, are the restaurant metrics tied to a goal. People use the terms interchangeably, and day to day the distinction rarely matters. What counts is that these restaurant metrics give you an objective view of your restaurant's financial performance, minus the wishful thinking. Used well, restaurant metrics turn guesswork into something you can act on.
So what do these restaurant metrics buy you? A clear picture of where money goes, which menu items pull their weight, whether your food costs are drifting, and where operational efficiency is slipping. Track the right restaurant financial metrics consistently and you catch problems while they're small. Ignore them and you find out at tax time, when it's too late to fix anything.
The 2026 numbers make the case. Food costs are running more than 35% above pre-pandemic levels, and roughly 42% of operators weren't profitable in 2025. Profit margins that thin leave no room for guessing, which is why more restaurant owners treat these numbers as a daily habit.
The essential restaurant metrics for financial health
These are the core restaurant metrics for financial health. As restaurant performance metrics go, these anchor your food costs, labor, and profit margins. Get them right and most of the others fall into place. Get them wrong and no amount of marketing saves you.
Cost of goods sold (COGS)
Cost of goods sold is the total cost of every ingredient that went into the dishes you sold over a set period. It's your raw food and beverage spend, full stop. It leaves out one-off costs like a new walk-in cooler, utility bills, or a plumbing repair.
For full service restaurants, COGS should cover consumable products only. Takeout boxes, cutlery, and straws belong in a separate budget, which keeps inventory clean.
Accurate COGS leans hard on good inventory management, since it's really an ingredient-counting exercise. Count stock sloppily and your goods sold number will be wrong too.
Why bother? Because COGS shows the real cost of food over time, not the theoretical version. It captures waste and shrinkage, all the food costs that never make it onto a plate and never make you a dime. Compare it against your theoretical cost and the gap tells you how much food is quietly walking out the door instead of hitting plates. Rising food costs almost always show up here first. COGS is also one half of prime cost, so it carries a lot of weight.
The formula:
Beginning inventory + additional purchases - ending inventory = COGS
Food costs and food cost percentage
Food cost percentage is one of the most-watched restaurant metrics for a reason. Where COGS is a dollar figure across your whole operation, food cost percentage zooms in on a single dish and tells you what slice of its menu price gets eaten up by food costs.
Why does it matter so much? Because it tells you whether your menu prices actually cover your food costs. If the percentage creeps up, that's rarely random. It usually points to something specific: portion creep, a supplier raising prices, or food waste from over-prepping. In a high-volume kitchen, a two-point jump across your menu items can quietly cost tens of thousands a year.
The benchmark most operators aim for: around 28% to 35% for full service restaurants, closer to 30% for casual dining, with fine dining running a touch higher. Sit in that range and your menu prices cover your total food costs without gouging guests or sacrificing quality. Drop your food costs too far, though, and you end up sacrificing quality on the plate.
Food cost percentage = cost of all ingredients / sale price x 100
Say a dish sells for $18 and its ingredient costs run $6. Its food cost percentage is 6/18 x 100 = 33%. Right in the healthy zone.
Average food cost per dish
Your average food cost is the mean ingredient spend across everything you sell, and it's a fast gut-check on menu-wide pricing. Track your restaurant's food costs at the dish level through your point of sale and the outliers show up fast, the menu items where actual food cost has drifted away from what the recipe food costs on the card say it should be. That gap between average food cost and actual food cost is where margin hides. When actual food cost climbs above your average on your top menu items, profit quietly disappears.
Labor costs and labor cost percentage
Labor cost is the total you spend on your team: wages, salaries, payroll taxes, overtime, and benefits. For most restaurants, labor costs are the second-biggest line item, usually behind only rent.
Because labor costs pull in so many variables, it helps to split them by role. Group positions that share a pay type (hourly versus salaried) so the math stays clean.
Total labor cost = employee wages + employee benefits + taxes
Then turn that into a percentage of revenue, the number operators actually track. Together, food and labor costs make up the bulk of what you can control.
Labor cost percentage = labor cost / total revenue x 100
A healthy labor cost percentage lands between 20% and 35% of revenue. Push past that and your restaurant's profitability takes the hit. And since labor is the other half of prime cost, keeping labor costs in line matters twice over. Higher-end spots run a higher labor cost percentage because service is hands-on; fast food restaurants keep labor costs leaner. If your labor costs are creeping up, there are practical ways to reduce restaurant labor cost without gutting service quality.
Prime cost
Prime cost is your two biggest expenses added together: cost of goods sold plus labor costs. That's it.
Prime cost = COGS + labor costs
This is the single most-watched number in the industry. It rolls your food costs and labor costs into one figure that touches everything, from menu pricing to staff scheduling to how much you can spend on marketing. If you're trying to cut costs or protect your profit margins, prime cost is the lever that moves the most.
Aim to keep prime cost around 60% of total sales, or 55% to 65% for the wider industry range. Too high and profitability suffers. Too low and you're underspending on ingredients or staff, which shows up on the plate. Track prime cost percentage per menu item and you'll see which menu items earn their spot.
Overhead and operating expenses
Overhead costs are everything else it takes to keep the lights on, the operating expenses that sit outside prime cost. None of them are food or labor.
A few common ones:
- Marketing and promotional spend
- Rent or mortgage
- Taxes
- Repairs and maintenance
- Utilities
- Licensing fees
These indirect costs matter because they drive your pricing, and indirect costs add up faster than most owners expect. Every menu item has to cover its share of both prime and overhead costs. If it can't, your operating costs outrun your revenue and you never hit break even. Knowing your overhead shows you where to trim and where you've got room to adjust menu prices to protect your profit margins.
Overhead = rent + marketing + taxes + licensing + repairs + utilities + other expenses
Fixed and variable costs
Your total costs split into two buckets. Fixed costs (rent, salaries, insurance) stay put month to month. The variable side moves with your volume: ingredient costs, hourly wages, marketing.
The fixed portion usually takes the bigger share, since rent is heavy. But watching the variable share over time flags trouble early, a spike in food costs, say, or hourly labor climbing faster than sales.
Percentage of fixed cost = fixed cost / total cost x 100
Percentage of variable cost = variable cost / total cost x 100

Profit and revenue metrics
Costs tell you what you spend. These restaurant performance metrics tell you what you actually keep, and how much revenue it takes to get there.
Gross profit and gross profit margin
Gross profit is what's left after you subtract cost of goods sold from total revenue. It's the money on hand to cover labor, overhead, and everything else.
Gross profit = total revenue - COGS
If gross profit can't cover labor and overhead, you're running at a loss, plain and simple. Most operators track it as a margin too:
Gross profit margin = gross profit / total revenue x 100
Say total revenue is $150,000 and COGS is $55,000. Gross profit is $95,000, and your gross profit margin works out to 63%. A healthy restaurant usually targets a gross profit margin around 70%. Strong gross profit is what funds everything downstream, so protecting it is really about protecting your profit margins.
Net profit and net profit margin
Net profit is the real bottom line: what's left after every cost comes out, including COGS, labor, overhead, and taxes. This is the honest read on how profitable your restaurant is.
Net profit = gross sales - prime costs - overhead expenses
Strong net profit means your current setup works and you've got room to grow. A weak one means something's off, and it's time to dig in before it gets worse. Most operators also track it as the net profit margin:
Net profit margin = net profit / gross sales x 100
Restaurant profit margins swing a lot by format, but a net profit margin of 3% to 6% is a fair average for the restaurant industry. Nobody's getting rich on a single plate; healthy profit margins come from volume and consistency. If yours are thin, there are proven ways to increase your restaurant profit margin without cutting corners. If your net profit margin sits below that range, your costs, not your revenue, are usually the culprit.
Break even point
Your break even point is the revenue you need just to cover all your costs. Not a dollar of profit yet, just even.
It's a blunt but honest indicator. If you're not clearing break even regularly, you can't generate profit, no matter how busy the dining room looks. Your break even point belongs in every restaurant business plan, and hitting it is a real milestone for any new restaurant.
Break even point = total fixed costs / ((total sales - total variable costs) / total sales)
Say your fixed costs are $4,000, variable spend is $2,000, and total sales hit $8,000 for the month. Your break even point is 4,000 / ((8,000 - 2,000) / 8,000) = $5,333. Fixed costs are easy to pin down; it's the variable costs, the ones that shift with volume, that make the break even point calculation fiddly.
Cash flow
Cash flow is the money moving in and out of your restaurant over a set period, usually a quarter or a fiscal year. Boiled down, it's your profit minus operating expenses.
You can have passion, a great team, and a packed book and still go under without cash. What's coming in, what's going out, and what you're holding are among the most important things to watch. Ignore cash flow and you can steer the restaurant toward the same fate that sinks so many others; dig into why restaurants fail and it almost always traces back to cash.
Cash flow = beginning cash - ending cash
Total sales
Total sales are the clearest snapshot of how the business is doing. On-premise, delivery, pickup, add them all up. Higher total sales, higher total revenue. Measured against your break even point, total sales tell you whether your profit margins are comfortable or you need to push.
Total sales = on-premise + delivery + pickup sales
Your point of sale system calculates total sales for you. But don't stop at the headline figure. Break restaurant sales down by menu items to see what's selling and what's dead weight, and split food and beverage sales, since beverage sales usually carry a fatter margin than the kitchen. Your food sales, tracked as total food sales, show how much revenue the menu itself is really pulling.
Sales per square foot
Sales per square foot tells you how hard your real estate is working. It ties directly into gross profit and cash flow, and it's one restaurant owners tend to check once a year rather than daily.
Annual sales / square footage = sales per square foot
It's most useful as a comparison, against last year, a second location, or others in the restaurant industry. Two rooms can pull the same total sales while one earns far more per square foot, and that gap usually comes down to layout, pacing, and how well you fill seats. It's a quiet but telling read on operational efficiency. A close cousin is RevPASH, revenue per available seat per hour; the RevPASH formula folds in seats and time, not just floor space.
Average check size and average customer headcount
Average check size, tracked next to average customer headcount, is what a typical guest spends per visit. It's a direct read on how well your team upsells and how many customers served you need to hit your daily revenue goals. Fewer customers served at a higher check can beat a packed room spending little.
Average check size = total sales / number of customers
Run it per shift, not just daily, because lunch and dinner rarely look alike. Track average customer headcount alongside it, how many guests actually walk in, and you'll see whether a soft night was a traffic problem or a spending one. When average check size dips but average customer headcount holds steady, the issue is spend, not footfall. Small moves to increase your average check size, a served appetizer here, a wine pairing there, add up faster than most owners expect. A $4 bump in average spend across 180 covers is real money.
Contribution margin
Contribution margin is the real-dollar profit each menu item kicks in after food costs. It tells you which menu items quietly carry your revenue.
Here's where it gets interesting, because food cost percentage and contribution margin don't always agree. A low food cost percentage looks great on paper, but it doesn't guarantee a fat contribution margin.
Fries that sell for $2 and cost $0.25 have a gorgeous 12.5% food cost percentage, but a contribution margin of just $1.75. A steak at $25 that costs $17 has an ugly 68% food cost percentage, yet its $8 contribution margin is more than four times the fries'. That's why the relative number can mislead you.
Knowing the contribution margin of every dish tells you which menu items to promote, which to reprice, and which menu items to quietly retire.
Operational metrics that keep costs in line
Financial metrics tell you what happened. These operational restaurant metrics tell you why, and whether your team is actually executing.
Inventory turnover ratio
Inventory turnover ratio is how many times you burn through and replace your entire stock over a given period. It sits at the center of food ordering, recipe costing, and menu pricing.
Average inventory = (beginning inventory + ending inventory) / 2
Inventory turnover ratio = cost of goods sold / average inventory
Your beginning inventory and ending inventory counts drive the whole ratio.
Why watch inventory turnover? Because the inventory turnover ratio touches food costs, waste, and cash flow at once. A slow inventory turnover ratio means product spoils on the shelf, tying up cash and inflating food costs. Turn too fast and you risk 86'ing dishes mid-service. Efficient inventory management lives right here, and a healthy inventory turnover ratio keeps cash moving instead of sitting on a shelf.
Food waste
Food waste is one of the quietest margin killers in the business, and it hides inside your COGS where it's easy to miss. Track it and patterns surface: over-prepped items, portions that are too generous, ingredients that spoil before they sell.
Cutting food waste flows straight to the bottom line, since every dollar of spoilage is food costs you already paid for and can never sell.
Table turnover rate
Table turnover rate is how many times, on average, your tables get seated during a period. It's central to using your capacity. A low table turnover rate means seats sit empty when they could be earning.
Table turnover rate = parties served in a period / number of tables
A high turnover rate is the goal, but not at the cost of the guest experience. Push too hard and people feel rushed. The right table turnover rate varies by format: a fine dining establishment sells a slower, longer meal and runs lower, while casual spots turn tables fast. Watch table turnover either way, because a bad rate quietly drains revenue. There are practical ways to improve your table turnover rate without making guests feel rushed.
Related is time per table turn, the average time a table stays occupied.
(parties served in a shift / number of tables) / hours in a shift = time per table turn
Serve 30 parties across a 2-hour shift with 12 tables and that's (30/12)/2 = 1.25 hours, about 1 hour 15 minutes per turn.
Employee turnover rate
Employee turnover rate is how often staff leave, whether through resignation, firing, or retirement. In an industry famous for churn, the employee turnover rate is one worth watching closely.
Employee turnover rate = employees departed / average number of employees x 100
Every departure costs time and money, and it chips away at your net profit. A high employee turnover rate often points to a culture problem or a hiring process that isn't screening well. Take a fast food spot averaging 25 employees that loses 15 in a year, that's a 60% employee turnover rate, and it makes it hard to maintain food and service quality. Keeping employee turnover low protects both your margins and your standards.
Server and labor productivity
Two quick ones tell you how hard your labor dollars work. Total sales by server is the volume each server rings up, so you can see who needs coaching and who's carrying the floor. Sales per labor hour (total sales / hours worked) reads productivity across the team and whether your labor costs are earning their keep. Casual spots post high productivity on lower labor; premium rooms accept lower productivity for better service.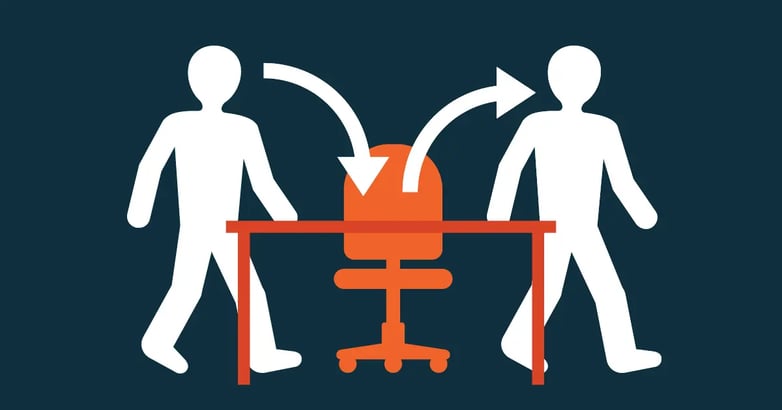
Guest metrics for customer satisfaction and loyalty
Not every number that matters is financial. Happy, returning guests keep your other restaurant metrics healthy, and customer satisfaction has never carried more weight than it does now.
Customer retention rate
Your customer retention rate is the share of guests who come back. Regulars are one of the cheapest, most reliable ways to grow revenue. A classic Bain and Harvard Business Review finding pegs a 5% lift in customer retention rate to a profit jump of 25% to 95%.
Customer retention rate = (total customers - new customers) / total customers x 100
A sagging customer retention rate is a symptom, not a diagnosis. Is it the food? The service quality? The wait? Dig until you find the root cause, then fix it. A strong customer retention rate is the clearest sign a successful restaurant business is getting the fundamentals right, and one of the most telling markers of customer satisfaction you can track.
Customer acquisition cost
Customer acquisition cost tells you what it takes to win a new guest. It's how you judge whether your marketing is actually working.
Customer acquisition cost = total marketing spend / new customers acquired
A rising customer retention rate often does more for profit than chasing new guests. Compare your customer acquisition costs across channels and you learn where to put your money. Social ads might look cheap per head, but if search brings in more customers acquired at a slightly higher cost, the math might still favor search. Watching your customer acquisition costs keeps marketing honest.
Reservations per day
Reservations per day is the raw count of bookings your restaurant takes in daily, no-shows and cancellations included.
For a data-driven restaurant, it's the cleanest way to read trends over time. Did a campaign land? Did the new special pull guests? Reservations per day answers those questions. If your reservation software has decent reporting, this one needs no math at all.
No-show rate
No-show rate is the share of bookings that never turn up, measured against total reservations for the same window.
No-show rate = no-show reservations / total reservations
No-shows are one of the toughest problems in the business, and the hit to sales is bigger than most guests realize. To them, an empty table just gets filled by someone else. It doesn't work that way. You usually can't release a held table for 15 to 20 minutes, and by then the revenue's gone. At a Michelin-starred room, two no-shows can wipe out the night's entire profit, which is why cutting restaurant no-shows is worth real effort. Know your average no-show rate and you can start driving it down.
Average rating score per month
Average rating score per month is exactly what it sounds like, the rolling monthly average of your guest reviews. In a market where diners read reviews before booking, it's a real signal of customer satisfaction and a genuine edge over the competition.
If your reservation system runs automated guest surveys, this score generates itself. Watch the trend more than any single month, and treat a dip as an early warning about service quality before it shows up in your covers.
How to track all of this without losing your mind
Nobody's calculating 25 formulas by hand every night. The operators who stay on top of their key metrics automate the boring part.
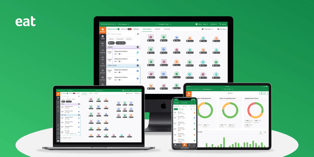
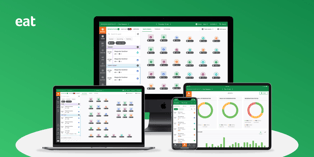
Connect your systems so the data flows on its own. Good restaurant management software pulls from your point of sale, inventory counts, and reservation book, then puts your restaurant data and analytics to work and hands you the restaurant performance metrics in one place. In an industry with margins this thin, that's the difference between reacting and getting blindsided by problems you never saw coming. Once the data's centralized, set a rhythm for these key metrics: some daily (total sales, labor), some weekly (customer satisfaction), some monthly (gross profit, inventory turnover ratio). The right restaurant management software turns hours of spreadsheet work into a ten-minute glance.
Ten focused minutes before service beats a 30-day-old accounting report every time. That's the payoff of tracking your restaurant's key performance indicators: you act while you can still change the outcome, and steer smarter pricing strategies before small leaks turn into big ones. The restaurant industry doesn't reward the busiest operators; it rewards the ones who watch the right restaurant metrics.
The bottom line
You don't have to track all 25 of these key restaurant metrics from day one. Start with the big three: prime cost, food cost percentage, and labor cost percentage. Get those tight, build the habit, then layer in the rest as you go.
The restaurants that last aren't the ones with the fanciest dashboards. They're the ones that actually look at the numbers and act before small leaks turn into real damage. If you'd rather have your metrics tracked for you than live in a spreadsheet, book a demo and see them all in one place.



.webp?width=314&height=175&name=Chit%20Printer%20Banner%20(8).webp)


.webp?width=144&height=72&name=Eat%20App%20Logo%20(3).webp "Eat App")