


.webp?width=200&name=Frame%202608526%20(1).webp)

-1.png?width=1812&height=1072&name=TripAdvisor%20%26%20More%20Bookings%20(1)-1.png)
-2.png?width=1812&height=1072&name=Google%20Bookings%20(1)-2.png)

.png?width=200&name=Google%20reservations%20(1).png)
-1.png?width=200&name=TripAdvisor%20%26%20More%20Bookings%20(1)-1.png)
-2.png?width=200&name=Google%20Bookings%20(1)-2.png)
-1.png?width=200&name=Instagram%20Bookings%20(1)-1.png)
-1-png.webp?width=200&name=Facebook%20Integration%20Rectangle%20(1)-1-png.webp)


.webp?width=200&name=download%20(1).webp)
%20(1)-2.webp?width=200&name=Eat%20(34)%20(1)-2.webp)
%20(1)-2.webp?width=200&name=Eat%20(18)%20(1)-2.webp)


The restaurant industry is one of the most competitive businesses out there. According to the National Restaurant Association, the US alone has over 1 million restaurants. To succeed in an industry where competition is high, the margin is tight, and 60% of businesses don’t make it past the one-year mark, regular performance tracking is essential.
The continuous assessment of a restaurant’s Key Performance Indicators (KPIs) allows owners to have a comprehensive understanding of current operations - what’s going right and what needs improvement.
If you’re unsure where to begin, here are a few KPIs that are commonly tracked in restaurants.
The Top 25 restaurant KPIs every manager should measure
Restaurant sales & cost KPIs
1. Cash flow
The right staff, passion for good food, and perseverance are all necessary for starting and operating a successful restaurant, but even the best-laid plans will fall flat without one vital component - cash.
The amount of money coming into and leaving your restaurant, as well as the amount of cash you have on hand, are two of the most critical things to monitor as a restaurant. If you don't regularly evaluate your cash flow, you might be dooming your restaurant to failure.
The formula to calculate Cash Flow Cash Flow = Beginning Cash - Ending Cash
2. Total sales
A restaurant’s total sales are a key indicator of success or failure. The higher the sales, the higher the revenue, which is why it’s critical to have measurable sales goals and keep track of them to evaluate restaurant performance.
3. Break-even point
The break-even point, which is the sales volume required to make back investment costs, should be used as a benchmark to set the total sales target to ensure that at the very least, the volume of sales is able to cover the costs and the restaurant is not suffering losses.
The formula to calculate your Break-Even Point 
Break-Even Point = Total Fixed Costs / ((Total Sales - Total Variable Costs) / Total Sales)
4. Cost of goods sold (CoGS)
To increase your profit margin, you should always be looking for ways to decrease your cost of goods sold. It's important you do this though without compromising on the quality of the guest experience or food.
Some of the common strategies restaurants put into action are - plan out your shifts daily to maximize usage of all your products, keeping lower inventory of less popular items and taking daily/weekly inventory of all your products.
The formula to calculate your Cost of Goods Sold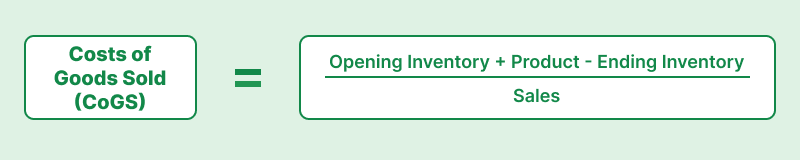
Costs of Goods Sold (CoGS) = (Opening Inventory + Product - Ending Inventory) / Sales
5. Prime costs
Prime costs include the cost of goods sold and labor costs. They represent the largest spending undertaken at a restaurant and therefore have a huge impact on restaurant performance. If costs are not tracked over time, restaurants can very easily go over budget and completely throw off the total revenue, and may even lead the restaurant to losses.
The formula to calculate your Prime Costs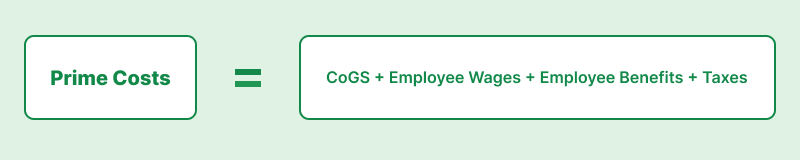
Prime Costs = CoGS + Employee Wages + Employee Benefits + Taxes
6. Overhead expenses
Any costs not included in the prime cost, like promotional and marketing expenses, rent/mortgage payment, repairs, licensing fee, etc. are included in overhead expenses. Just like prime costs, if not tracked correctly, overhead expenses can negatively impact revenue. It’s also important to know exactly where the money is being spent to identify areas that can be better optimized to improve profitability.
The formula to calculate your Overhead Expenses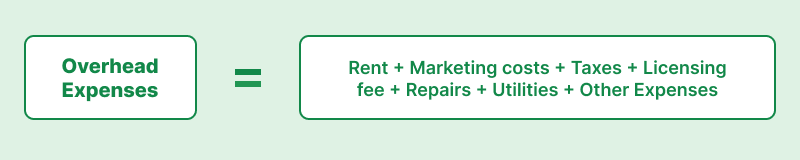
Overhead Expenses = Rent + Marketing Costs+ Taxes + Licensing Fee + Repairs Utilities + Other Expenses
7. Gross profit
Gross Profit refers to the total revenue earned by a restaurant after deducting COGS. It’s a key indicator of performance as it represents the amount of money a restaurant has available to pay labor and overhead costs.
The goal gross profit must be set high enough to be able to cover costs at the minimum and ideally, lead to some amount of net profit. If the gross profit is not able to cover the labor and overhead costs, the restaurant will remain in a state of loss.
The formula to calculate your Gross Profit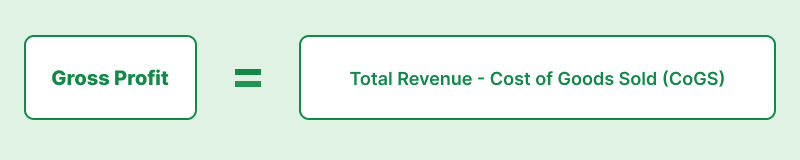
Gross Profit = Total Revenue - Cost of Goods Sold (CoGS)
8. Average check size
The amount of money spent by customers per visit i.e. the average check size is a good measure to indicate the number of customers required to meet your break-even point and daily revenue goals. Tracking it over time can help restaurant owners identify any discrepancies and take corrective action immediately. Using a reservation system that integrates with your POS system can significantly reduce the effort needed to collect this data.
The formula to calculate your Average Check Size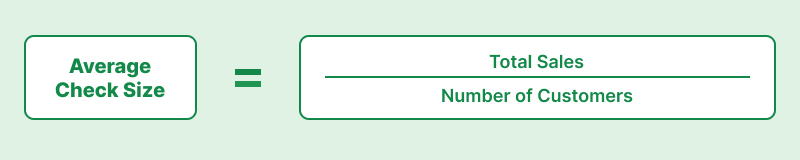
Average Check Size = Total Sales / Number of Customers
9. Labor cost ratio
The correlation between labor costs and gross sales is known as the labor cost ratio. Hourly pay, payroll taxes, health care costs, and other related costs may all be included in labor costs.
The formula to calculate your Labor Cost Ratio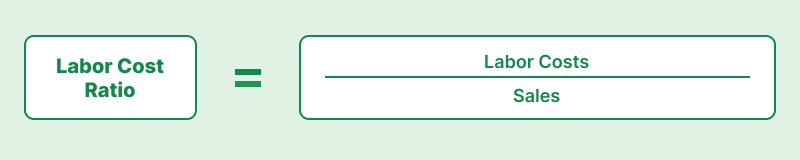
Labor Cost Ratio = Labor Costs / Sales
Restaurant employee KPIs
10. Employee turnover rate
The frequency at which employees leave a restaurant over a period of time i.e. the employee turnover is a crucial performance tracker. While some turnover cannot be avoided, the benchmark rate should be as low as possible. Hiring and training staff is an expensive undertaking, therefore a high turnover rate will have a negative impact on your revenue.
If you notice a spike in your employee turnover rate, reevaluate your hiring and training process, as well as your work culture.
The formula to calculate your Employee Turnover Rate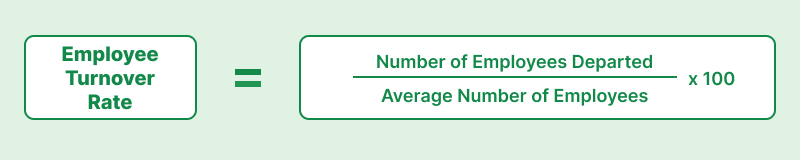
Employee Turnover Rate = (Number of Employees Departed / Average Number of Employees) x 100
11. Total sales by server
Total sales by server refer to the volume of dollar amount a server is responsible for in a given period of time. It helps restaurant owners get an insight into the performance of individual servers. Comparing the total sales of each server can help identify the ones that require some more training or need to be replaced to improve overall restaurant operations.
12. Per person average
You can monitor the amount of sales made by a server by looking at their per-person average, also known as their per-guest average. It's crucial to monitor this data to determine which servers generate the most revenue for your company.
You must also consider other factors, such as customer service, table turn-time, and the number of guests served per hour, in addition to a server's average service time per person.
The formula to calculate your Per Person Average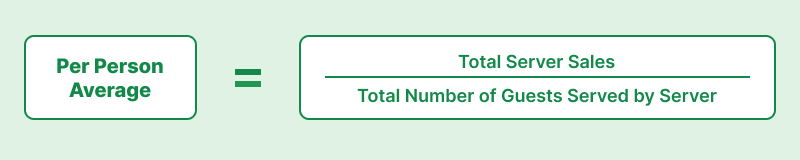
Per Person Average = Total Server Sales / Total Number of Guests Served by Server
13. Number of guest served per hour
The efficiency of each staff member can be determined by keeping track of the number of guests (not tables) served per hour. Additionally, it's beneficial to contrast customer feedback and the number of guests served. High-performing servers will do well in both categories. Consider reducing customer volume and providing that server with more training if they have a lot of customers but receive negative feedback from them.
The formula to calculate your Number of Guests Served Per Hour
Guests Served Per Hour = Total Number of Guests Served / Number of Service Hours Worked
14. Server errors per guest
It's a good idea to keep track of a server's mistakes to find out how frequently they happen because items that are rung up incorrectly in a POS system result in higher costs, disgruntled customers, and low team morale. Management can take action to address the issue and lower the number of mistakes by determining how many server errors there are.
The formula to calculate your Number of Guests Served Per Hour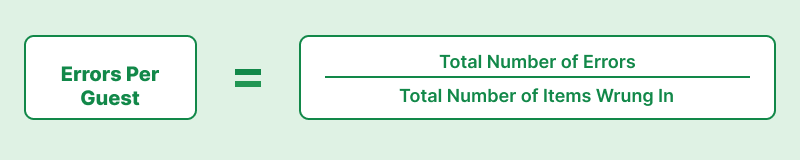
Errors Per Guest = Total Number of Errors / Total Number of Items Wrung In
Restaurant reservation KPIs
15. Walk-in vs. reservations
For restaurants that accept reservations, being aware of the walk-in vs. reservation rate can indicate where most of their guests are coming from. If the reservation rate is higher, it means that people prefer booking a table, and therefore, the restaurant should focus more on getting reservations rather than depending on walk-in customers.
An easy way to find out your walk-in vs reservation rate is through a reservation system like Eat App that provides in-depth reports about a restaurant’s guests.
Related: How restaurants are using data to improve revenue
16. No-show rate
No-shows are one of the biggest hurdles that restaurants have to overcome to succeed. Given its significant impact on revenue, it’s critical to keep track of the no-show rate at your restaurant. A good no-show rate differs from restaurant to restaurant. Set a benchmark for your restaurant based on factors such as type of restaurant, size of tables, target audience, etc.
The formula to calculate your No-Show Rate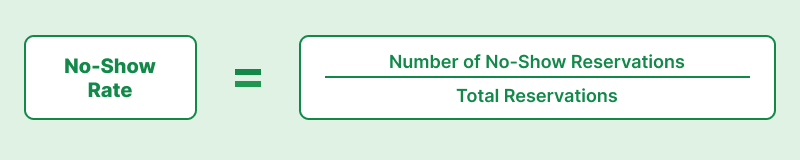
No-Show Rate = Number of No-Show Reservations / Total Reservations
Read more about reducing your restaurant’s no-show rate.
17. Cancellation rate
A high cancellation rate can lead to empty tables and lost revenue, and can hinder your restaurant’s goals. While some cancellations are inevitable, it’s important to set a benchmark and regularly measure them to identify any spikes in cancellations and take action accordingly.
The formula to calculate your Cancellation Rate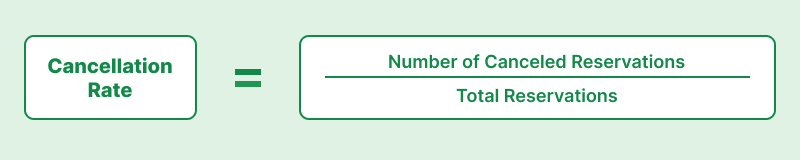
Cancellation Rate = Number of Canceled Reservations / Total Reservations
Other restaurant KPIs
18. Customer retention rate
Customer retention rate refers to the percentage of return customers in your total customer volume. Regular customers are a restaurant’s bread and butter, so it’s important to ensure that you’re able to retain as many as possible. A drop in retention rate can indicate problems in your restaurant operations, and keeping track of it can help identify these issues as soon as possible.
The formula to calculate your Customer Retention Rate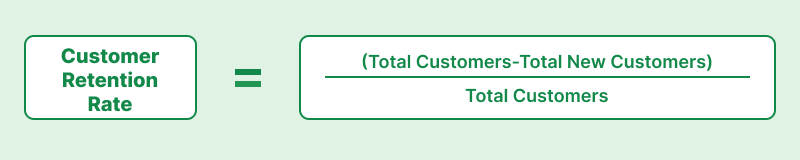
Customer Retention Rate = (Total Customers - Total New Customers) / Total Customers
19. Table turnover rate
The average number of times a restaurant’s tables are occupied in a period of time, i.e. the table turnover rate is an important factor for optimizing restaurant capacity. You want to make sure that your floor space is being used to its maximum potential at all times, which is why keeping track of your table turnover rate is crucial.
Low turnover rates can significantly impact revenue, but very high turnover rates can impact customer service. The optimal turnover rate depends on the type of your restaurant. Fine dining restaurants tend to have a lower turnover rate than casual restaurants where service is not an important factor. Assess your restaurant and set a benchmark turnover rate accordingly.
The formula to calculate your Table Turnover Rate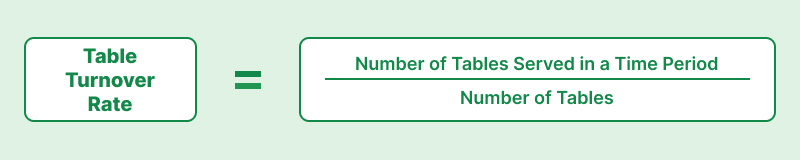
Table Turnover Rate = Number of Tables Served in a Time Period / Number of Tables
20. RevPASH
Revenue Per Available Seat Per Hour or RevPASH is a metric that calculates your dining room’s performance by taking into account revenue, seats, and time altogether.
Keeping track of RevPASH helps restaurants optimize seating, increase guest spend, and improve their overall dining room occupancy and revenue.
The formula to calculate your RevPASH
RevPASH = Revenue in a Given Time Period / (Number of Hours / Number of Seats)
Related: Grow Your Restaurant Revenue with the RevPASH formula
21. Average table occupancy
Average table occupancy investigates the typical number of patrons who frequent a restaurant over a period of time. This rate can be used by restaurants to assess how well they are utilizing their available seating.
The formula to calculate your Average Table Occupancy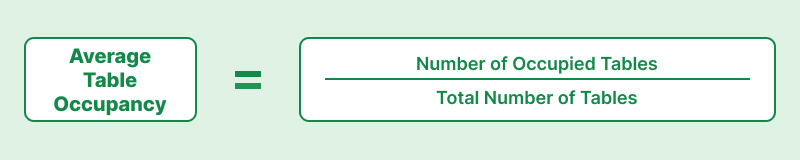
Average Table Occupancy = Number of Occupied Tables / Total Number of Tables
22. Food wasted
A company looking to reduce waste in their operations can benefit from calculating food waste, which is a percentage of the amount of food that is left over after being purchased. Usually, this entails weighing the food that was wasted and dividing the amount of food that was purchased overall by the amount of food that was left over.
The formula to calculate your Food Wasted
Food Wasted = Weight of Wasted Food / Total Food Purchased
Restaurant marketing KPIs
23. Social media metrics
If social media is a big part of your restaurant’s marketing strategy, it’s important to be consistently aware of your performance on different platforms. Keep track of your followers, engagement, and reach on Instagram, Facebook, and any other channel that you are present on to see how well your current strategy is working to attract your target market.
24. Email marketing metrics
Email marketing is a great way to attract and retain more customers. However, it’s important to ensure that your current email strategy is effective. Evaluating email metrics like open rate and click-through rate on a regular basis can help you evolve your current strategy with more data-backed insights.
Read More: 5 Simple Email Marketing Ideas For Restaurants
25. Online review metrics
Reviews help restaurants better understand customers and their needs. Stay up-to-date with your online review ratings on platforms like Tripadvisor to know what your customers are happy with and identify any issues in operations that may be leading to unhappy reviews.
An easy way to track guest reviews is by setting up an automated survey through Eat App, which not only helps you collect more feedback but also provides regular reports about your restaurant’s current survey metrics.
Find out more about Eat App’s automated survey system here.


.webp?width=314&height=175&name=Chit%20Printer%20Banner%20(8).webp)


.webp?width=144&height=72&name=Eat%20App%20Logo%20(3).webp "Eat App")